Risk versus Reward

All investing carries risk and the basic principle is that if you are prepared to take greater risk then you should receive greater rewards.
Investing in low risk assets makes it less likely that you will lose all or some of your investment but this comes hand in hand with the likelihood that you will not receive high returns. Likewise, if you are prepared to invest in assets with high volatility, and greater likelihood of large losses, then you should also see a higher potential growth.
This balance is often called the risk/reward profile.
When comparing, for example, two investment funds, they may have had similar returns over a period of time but have achieved those results with dramatically different levels of volatility; the fund that has achieved the same results but with a lower level of risk would have a more attractive risk/reward balance.
Risk versus Reward chart
The risk versus reward chart is a useful indicator of this balance. The below is a scatter chart plotting annualised returns on the vertical axis and volatility on the horizontal axis. The position of a fund is plotted between these axes. The crosshairs provide a reference point for the chart, for example the relevant Morningstar Category average or a benchmark.
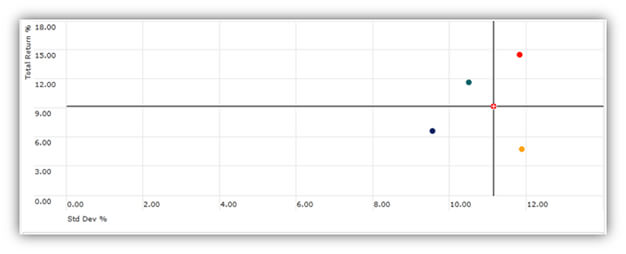
In the chart above, the red plotted fund has achieved above average returns with above average volatility, so the risk/reward balance looks reasonable. In comparison, the orange plotted fund has shown returns significantly below the average with a high level of volatility; in this case perhaps it could be stated that the fund has not provided sufficient reward for the level of risk.
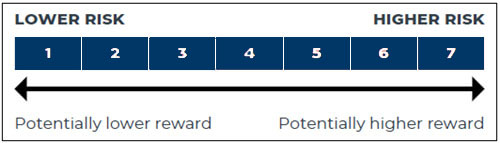
Synthetic Risk and Reward Indicator (SRRI)
You can also see risk versus reward in the synthetic risk and reward indicator (SRRI) in KIIDs for UCITS funds, which awards a rating from 1 to 7 that is intended to indicate the level of risk and potential return you could expect.